

There are many different approaches traders can try out in search of the one that suits their needs. Technical analysis is one of them: it involves analyzing past market performance using technical tools, such as trend lines and indicators. With this method, traders can choose different instruments, combine them for optimal results and make decisions based on their analysis and risk tolerance. However, if you are a novice trader, it may be hard to use all these tools from the get-go. Learning about some ground rules might be a good place to start.
Today we will take a look at laws of technical trading proposed by John Murphy – a renowned technical analysis expert. He wrote several books on this subject, including “Technical Analysis of the Financial Markets”. John Murphy’s laws of technical trading may come in useful for both professional and novice traders, so let’s take a look at what they have to offer!
The trend is the Key
John Murphy offers an impressive list of ideas and tools for technical analysis of financial markets. However, most of them are focused on the concept of market trends. He claims that trend is essential to the technical analysis approach. Moreover, the majority of the instruments used in the process are aimed at measuring the trend and participating in it. So don’t be too surprised when you realize that the following rules are also connected to this concept in one way or another.
Map the Trend
Some novice traders might underestimate the value of studying price charts. However, they may be a great source of trading ideas. John Murphy proposes to begin your technical analysis with long-term timeframes. It may provide you with a more in-depth understanding of the trends, and offer a perspective on how an asset might perform in the future.
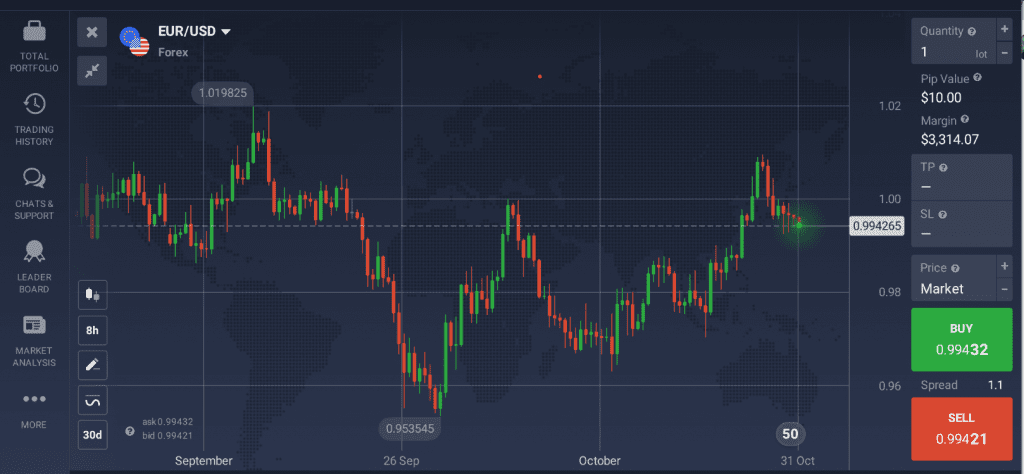
Once you have analyzed the asset’s long-term performance, you may turn to more short-term trends. Keep in mind that short-term price fluctuations can sometimes be misleading. So it may be useful to consider long-term asset performance when making trading decisions.
Spot the Trend
After analyzing the long and short-term price fluctuations, you may be able to spot a trend – a direction of the price movement. It may point to potential trading opportunities. The key is to trade in the direction of this trend. For instance, if there is an upward trend, you might pick up this asset during the next dip. On the contrary, if the chart points to a downward trend, you may consider selling. However, you should always consider the risks that trading entails and keep in mind that even trading in the direction of a trend does not guarantee profit.
To make sure you are spotting the right trends, consider using trend lines. Here’s where rule #3 comes in.
Draw the Line
Trend lines are one of the most straightforward technical analysis tools. To apply them, connect several points on the prices chart (recent lows for the potential uptrend and highs for the downtrend). Remember that the line should touch the chart at least three times.
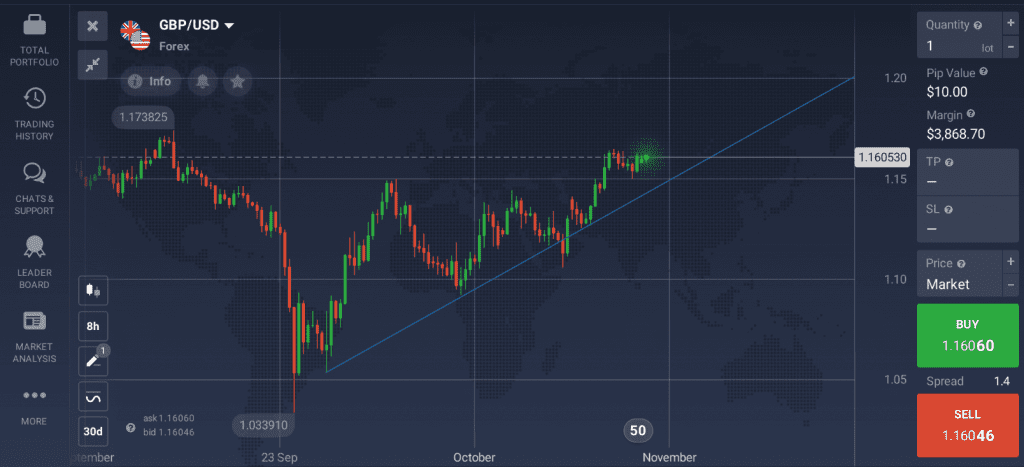
There may be breakouts: sometimes they can point to a change in the trend. However, the price may pull back, and the trend might resume after some time. So you should consider different outcomes and trading decisions based on your own technical analysis of the financial markets.
Use Support and Resistance
If you managed to draw the trend lines, you may then create support and resistance levels for the asset’s price. The support level can be seen as the lower threshold for the price line. The resistance level is the opposite – it is the upper barrier, pointing to the highest price points.
When the price line reaches the support level, traders might expect it to stop and bounce back. Conversely, if the price touches the resistance line, it may then go down to stay in the price corridor. You may use these opportunities to open either long or short positions if you expect the trend to continue.
Sometimes the price moves beyond these levels, and a breakout occurs. If the price breaks through the support line, it may become the next resistance level. The same can be said for the resistance level – it can quickly turn into the next support level.
Know Your Retracements
Sometimes the market can correct itself, with the price moving up or down from the existing trend. You may measure these short-term price movements by using tools like Fibonacci Lines. When you apply this instrument, you will see a collection of horizontal lines that correspond to different Fibonacci ratios. During the uptrend, Fibonacci Retracement may point to a buying opportunity during a pullback. When it comes to the downtrend, Fibonacci lines might help determine the optimal short-selling positions.
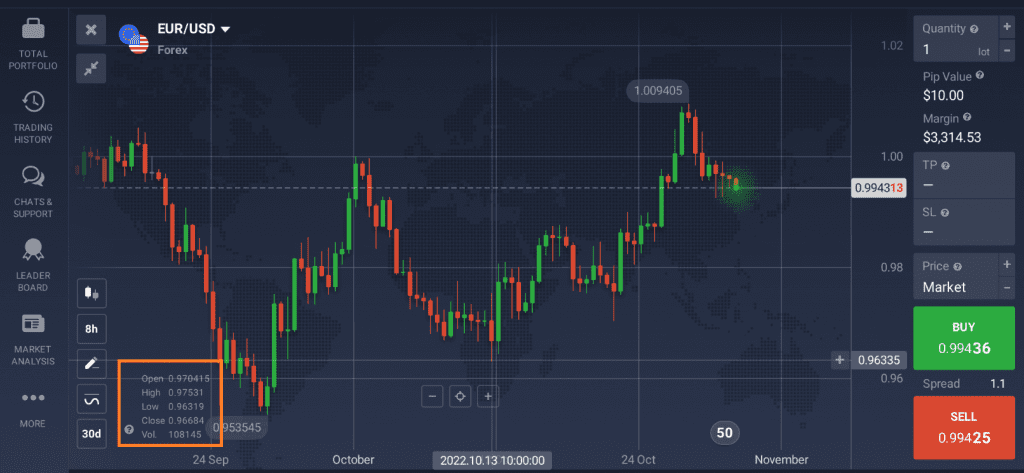
Track the Volume
One more factor to keep in mind when using technical analysis for trading is volume. It represents the total amount of trading activity over some time. When you notice increasing trade volume in the direction of the existing uptrend, it may serve as additional confirmation. If the trade volume is on the decline, the current trend might be coming to an end.


0 Comments